Functionality made for media at scale.

Pingtree is an end-to-end marketing analytics platform that operationalizes team to deploy campaigns from ad to conversion all through one, codeless interface.

Want to view pricing? View Pingtree Pricing

Field Mapping Transformer Tool

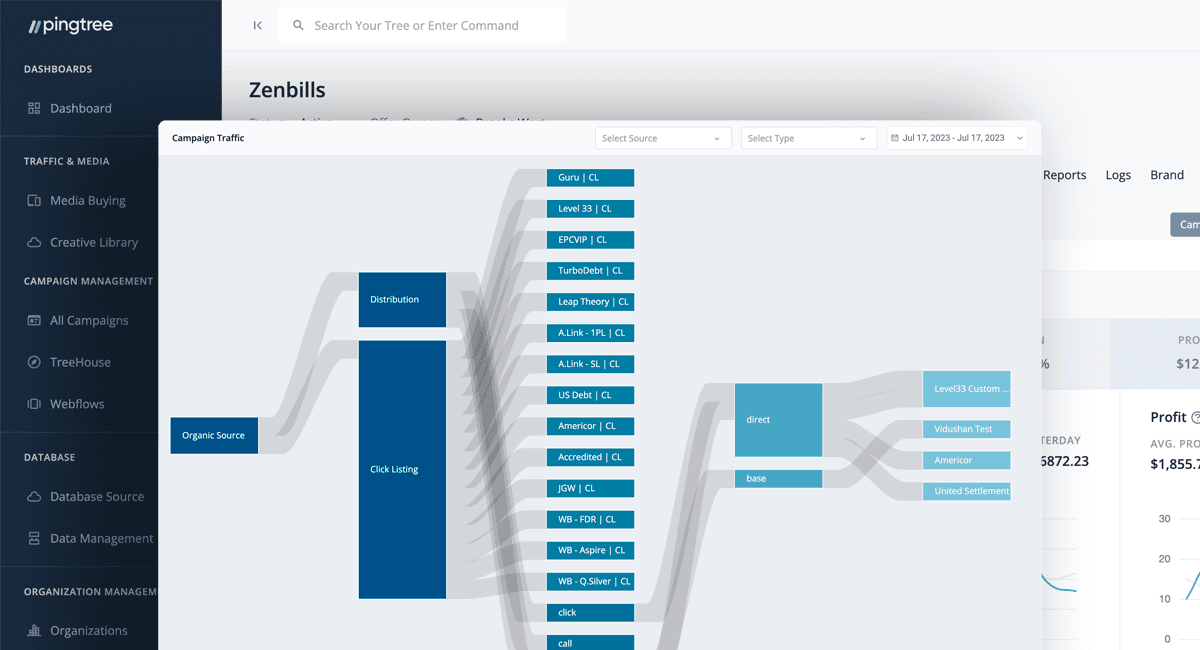
HPingtree’s newly released Transformer Tool gives you the versatility to post your lead data via API in different formats. This tool comes in handy in instances where you’re running an offer and have multiple lead buyers. Depending on the buyer, they may only accept values in certain formats.

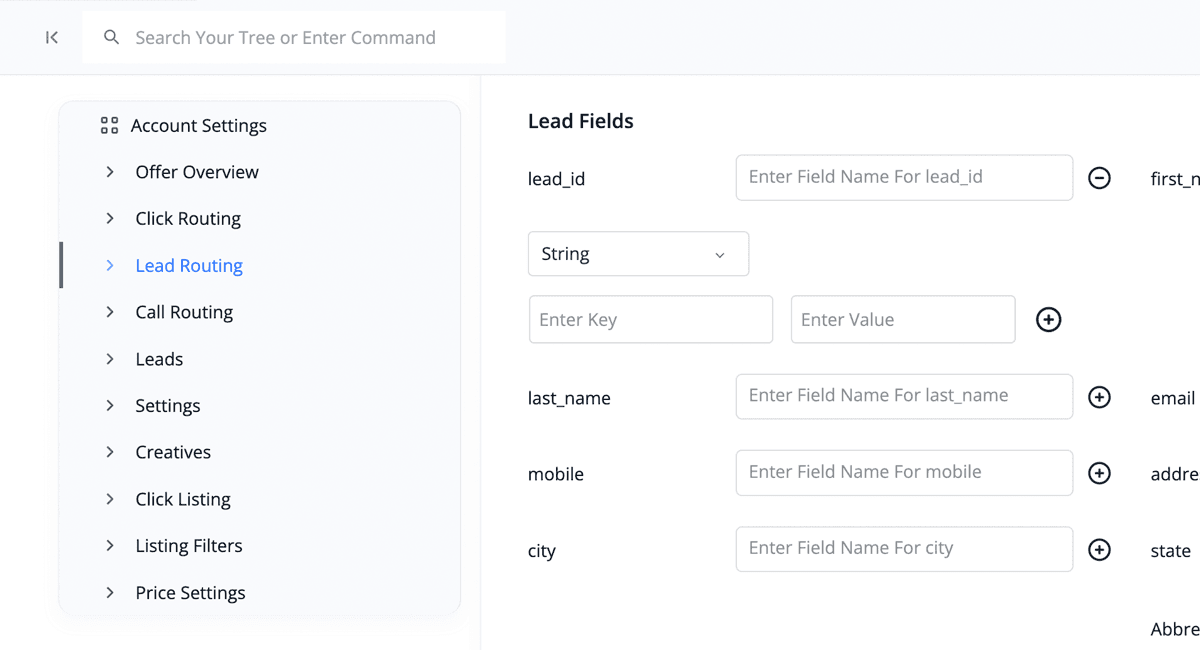
This tool allows you to specify the way in which you send particular values to a specific endpoint. It captures the value of the field you're ingesting and “transforms” it into the format of your choosing.

Example: Assume you are running your own offer for insurance products. The values you’ve set up to be passed to you in the backend of that offer are formatted as a string value and are as follows: “Homeowners Insurance”, “Life Insurance”, “Car Insurance” and “Flood Insurance”.

Now assume you have a few different buyers in this campaign purchasing your lead, however one of your buyers ONLY accepts these field values in a number format like so: “1=Homeowners Insurance”, “2=Life Insurance”, “3=Car Insurance” and “4=Flood Insurance”.

This tool eliminates the hassle of creating new values to map to in the offer itself and gives you a highly simplified way to send those same values to a buyer or endpoint.

Improvements

  • Updated the transformer formats to include string, boolean, number or date
  • Improved versatility of the date formatter to include sub-formats including, ISO 860, short date, unix timestamp and custom formatting.

Creative Library

How much would your optimization efforts be improved if you had access to a centralized database to manage and view performance metrics for all of your first party media? Pingtree’s Creative Library feature gives you this and more! Detailed analysis of your ad creatives from TikTok, Google, Meta, Youtube and many others… at your fingertips.

Ad Creatives which are initially uploaded into your ad manager account across various media channels can be exported and uploaded into Pingtree’s “Creative Importer” tool. Using this tool will allow you to map the ad creative’s unique ID over to Pingtree’s “MAID” (Marketing Ad ID) so you can manage and compare ads in real time.

Improvements

  • Bulk Creative Importer tool allows you to upload all of your creatives at once
  • Kanban process: Manage the approval process of your creatives through a multi-step flow to ensure your ads go through a proper due diligence process
  • Build your own creative comparison to analyze the performance of different ads across different platforms
  • Implemented additional attribution parameters for ultimate analysis

Data Importer Tool with Fuzzy Match

Import a CSV of lead data directly into your Pingtree Database and upload it directly to your campaign. Using the fuzzy match tool, Pingtree will search through all of your leads in that campaign to determine if there are leads with missing data, and will let you associate the missing data with the correct lead.

Improvements

  • Ability to attribute events and financial data such as revenue and payouts to the lead
  • Choose how you want financial data attributed to a lead: “Add to”, “Override”,

SubID Reporting

By selecting your traffic source(s), you’re able to analyze performance based on the subIDs of your choosing which helps to improve your monetization strategies.

Improvements

  • Column customization: Choose which columns and data you wish to display
  • Added the ability to add multiple traffic sources to compare against at one time
  • Use this feature to make a ‘full funnel’ view. This will allows you to see the entire picture from a click to metrics far beyond the conversion, such as LTV.

Customizable Table Columns

One size does NOT fit all with marketing analytics. Knowing this, Pingtree created custom columns to give you a personalized approach to analyzing data and performance. Within different reports and tables in Pingtree, you’re now able to manipulate the data you visualize based off of any system fields, custom fields or events in your campaign.

Improvements

  • Rearrange the order in which you view columns in your table
  • Ability to choose whether you want your data displayed as a sum, count or average
  • For columns that are also events you’re able to decide to include revenue or payout data as well.

Analyze Traffic With Sankey Charts

We're sure you have seen Sankey charts (most likely Google analytics) and have used them to determine the flow of traffic to your website. Now you can use the same type of view to see how the clicks or forms are coming to your site and how they are monetizing.

This is useful for you to: track source performance, determine traffic flow to offers, analyze variations, partners and more. This is best used for Lead Generation and E-Commerce offers (with multiple products). Let the traffic control begin!

Improvements

  • Added chart to filter by source or media channel to separate the flow to a single source
  • Fixed hover to darken the flow when separating the traffic from link to forms or from variation to variation
  • Improved chart height scaling to help manage the viewport better for power users and enterprise companies with many products/SKU's
  • Fixed bug that sometimes made the node coloration disappear from the view

State Management Tabs files

Why have multiple tabs when you can just have one? State Management improvements allowed the application to store each view and save it to a tab so you can "tab" inside one tab. This use case is great for setting up or managing campaigns where you are looking at many settings or reports to make updates. With a quick tab, you can revert back to any page where you left off. Hit opt + t

Improvements

  • Added browser based tabs UI that allows user to navigate to the last page(s) easier
  • Improved performance and use by clearly labeling the tabs
  • Fixed orientation of the tabs on the newest entry to feel native to how a web browser functions

Quick Search Modal

By clicking the search icon using a keyboard shortcut, the search modal is a powerful tool to locate any piece of data in the application with a single search. Just click enter and go.

Improvements

  • Added transaction ids, events, and all user data found in base campaign fields
  • Separated data into classification with < hr > line to give better optical speartion
  • Made keyboard shortcut for opening the modal

Account Personalization

Accounts can now have an enhanced level of personalization from alerts to avatars. Make your time in the office more enjoyable by adding features that improve your product experience.

Improvements

  • Add custom personalization such as Avatars
  • Update the color palette/theme to one that is more tasteful to your eyes
  • Set emails and notification preferences to get the right data at the right time